JTAG
There is one JTAG interface on the phyCORE-AM64x SOM that is broken out to three different locations on the phyBOARD-Electra. This guide which will show you how to connect to and verify the onboard XDS110 JTAG debugger via a Connection Integrity Test executed using TI’s Code Composer Studio IDE. To learn more information about the phyCORE-AM64x JTAG debug interface, please see section 10.1 in the Hardware Manual.

Location |
Header Type |
Notes |
|---|---|---|
X21 |
micro-USB |
XDS110 JTAG debugger |
X22 |
Compact TI 20-Pin JTAG Header |
Requires external JTAG debugger |
X27 |
60-pin Expansion Connector |
Requires external JTAG debugger |
Requirements
USB micro-AB Cable (Included in development kit)
Development Kit Setup
Power off the development kit and disconnect power.
poweroff
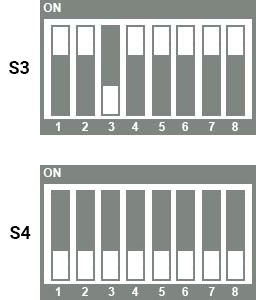
Set the boot switches to the following “NO BOOT” boot mode.
S10 should be ON

Connect the USB Micro-AB cable to the X21 JTAG connector and reconnect the power supply to the development kit.
Confirm that you do not see any new boot messages on the serial console.
Host Setup
Download the latest CCSTUDIO installer for your Windows host machine.
Note
You could install this for your Linux VM however it is recommended to install this into the native OS of your Host Machine to avoid dealing with USB pass through related issues. PHYTEC generally runs native Windows machines and then hosts Linux build systems as a VM or on remote servers.
Unzip the installer archive and run the installer.
As you work through the installer prompts:
Select the Custom Installation Setup Type:

When prompted to Select Components, enable Sitara AM3x, AM4x, AM5x and AM6x MPUs.

When prompted to Install debug probes, ensure that the Spectrum Digital Debug Probes and Boards option is selected (should be done by default but will depend on the version CCS being installed):

Complete installation and then launch Code Composer Studio.
Warning
Refer to these if you find that you need to recover/update the firmware on the debugger.
The phyCORE-AM64x development comes equipped with a on-board XDS110 USB debug probe that enables the AM64x processor’s JTAG interface. To update the JTAG debugger, follow these steps to do so once you have Code Composer Studio installed:
Open your Windows host machine’s command prompt (this can be done by hitting the Windows key, typing CMD, and then hitting enter).
Navigate to the directory in which Code Composer Studio was installed (by default this should be C:\ti\ccs1210, or similiar depending on the version of CCS you are working with).
Host (Windows)cd C:\ti\ccs1210
Navigate to the USCIF driver’s xds110 directory:
Host (Windows)cd ccs\ccs_base\common\uscif\xds110
Ensure that your Windows host machine has a valid connection with the phyCORE-AM64x development kit’s X21 USB micro-AB port.
Scan the USB bus for supported XDS110 devices:
Host (Windows)xdsdfu.exe -e
Expected OutputC:\ti\ccs1210\ccs\ccs_base\common\uscif\xds110>xdsdfu.exe -e USB Device Firmware Upgrade Utility Copyright (c) 2008-2019 Texas Instruments Incorporated. All rights reserved. Scanning USB buses for supported XDS110 devices... <<<< Device 0 >>>> VID: 0x1cbe PID: 0x00ff Device Name: Tiva Device Firmware Update Manufacturer: Texas Instruments Incorporated Serial Num: 00000000 Mode: DFU Found 1 device.
Ensure that the JTAG device on the development kit is found during the scan.
Set the debugger to DFU (Device Firmware Upgrade) mode in case it isn’t there by default:
Host (Windows)xdsdfu.exe -m
Expected OutputC:\ti\ccs1210\ccs\ccs_base\common\uscif\xds110>xdsdfu.exe -m USB Device Firmware Upgrade Utility Copyright (c) 2008-2019 Texas Instruments Incorporated. All rights reserved. Scanning USB buses for supported XDS110 devices... Device is already in DFU mode. No switch necessary.
Flash a fresh bootloader to the XDS110 Debugger:
Host (Windows)xdsdfu -b boot_loader.bin -r
Expected OutputC:\ti\ccs1210\ccs\ccs_base\common\uscif\xds110>xdsdfu -b boot_loader.bin -r USB Device Firmware Upgrade Utility Copyright (c) 2008-2019 Texas Instruments Incorporated. All rights reserved. Replacing the bootloader may render the XDS110 unusable. Do you want to continue (Y/N) ? Y Scanning USB buses for supported XDS110 devices... Downloading boot_loader.bin to device...
Double check that your debugger is still in DFU mode (this may be the case but it doesn’t hurt):
Host (Windows)xdsdfu -m
Flash the debugger firmware (note that the firmware version may be different depending on the version of CCS you are working with):
Host (Windows)xdsdfu.exe -f firmware_3.0.0.22.bin -r
Expected OutputC:\ti\ccs1210\ccs\ccs_base\common\uscif\xds110>xdsdfu.exe -f firmware_3.0.0.22.bin -r USB Device Firmware Upgrade Utility Copyright (c) 2008-2019 Texas Instruments Incorporated. All rights reserved. Scanning USB buses for supported XDS110 devices... Downloading firmware_3.0.0.22.bin to device...
Once complete, disconnect the USB cable from the X21 JTAG connector and then re-connect it. This is necessary in order to prevent a known problem that can occur on the first JTAG integrity scan in the following steps.
The XDS110 debugger should be good to go now. This can be verified by opening your Windows “Device Manager” and confirming that the X21 COM port displays as “XDS110 Class”.

Note
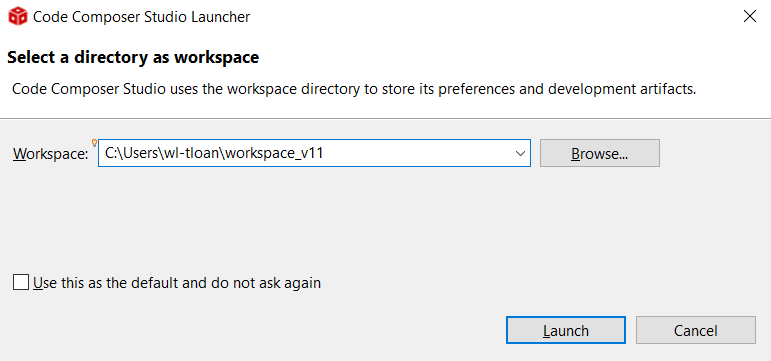
The following Workspace location is just an example, the default location for you will probably reflect the user you are logged in as.
Create a new workspace (it is recommended to choose a workspace directory without any spaces in the path, we at PHYTEC have experienced issues with the Sitara SDKs when it comes to their build scripts and spaces in paths).
Once CCS has launched navigate to View → Target Configurations.
Right-click inside the Target Configurations pane and select New Target Configuration.
Name the configuration AM64x_XDS110_USB.ccxml.

Set the connection to Texas Instruments XDS110 USB Debug Probe and the Device to AM64x.

Hit the Save Configuration button.
Now you can hit the Test Connection button. You should see a few tests run and complete successfully, including a reset of the processor and integrity scans.
