Debug an Application
Prerequisites
Ensure that Linux is booted on the phyBOARD-Lyra AM62x, with a bootable SD card plugged into the system. If the SD card is missing or not set up, refer to the section SD Card for instructions on flashing the SD card.
Note
This section requires the firmware to be compiled using the Debug target. To do this, click the arrow next to the hammer icon in the toolbar and select Debug. Then, click the hammer icon again to rebuild the firmware with the correct target.
Connecting the Debug Probe
The phyBOARD-Lyra AM62x is equipped with an XDS110 debug probe. To initiate debugging, connect a USB Micro cable to the second USB port on the board, labeled X4.
Note
If the XDS110 debug probe is not connected correctly, you will encounter the following error message:
An attempt to connect to the XDS110 failed. [...]: no XDS110 is connected, valid
Step 1: Prepare The Project
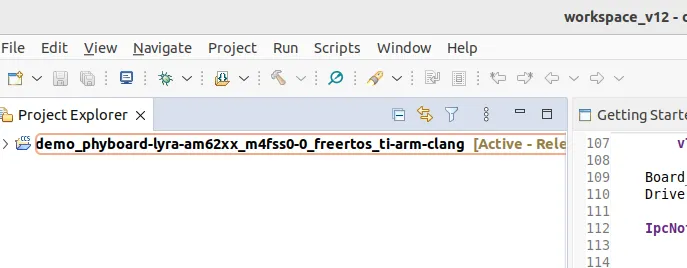
Open Code Composer Studio (CCS) and navigate to the PHYTEC Example Firmware directory, as outlined in the section Building an Application.
Click on Run > Debug.
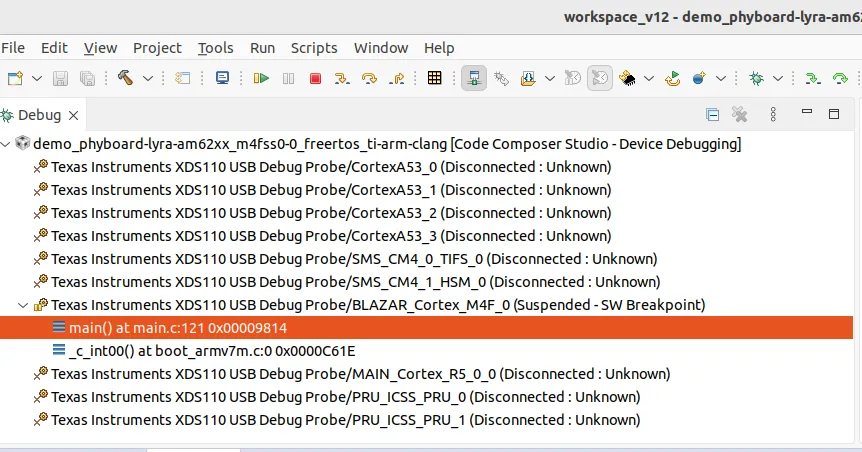
In the pop-up window, select only the BLAZAR_Cortex_M4F_0 CPU, and deselect all other cores.

CCS will initialize the system. Once initialization is complete, the debug session will automatically pause at the first breakpoint in the
mainfunction.
At this point, you are ready to start debugging.
Debugging Controls
You can now interact with the debug session using the following options:
Resume (F8): Continue execution until the next breakpoint is reached.
Suspend (Alt + F8): Pause the running firmware at the current execution point.
Step Into (F5), Step Over (F6), or Step Return (F7): Navigate through the code.
Terminate (Ctrl + F2): End the debug session and return to the source code.

Tip
You can set additional breakpoints by right-clicking on a line in the source code and selecting Breakpoint > Breakpoint from the context menu.
Step 2: Flashing the Application via JTAG
To flash the firmware directly onto the M4F core via JTAG:
Click the Load Firmware button (represented by a folder icon with a white sheet and brackets) located between the green bug and hammer icons in the toolbar.
The firmware will be built and flashed directly onto the M4F core, and the application will start running automatically.

After flashing, the application will be ready for further debugging or testing.
Note
For any technical questions, feel free to reach out to PHYTEC’s Support Portal!