JTAG
There is one JTAG interface on the phyCORE-AM64x that is broken out to two different locations on the phyBOARD-Electra AM64x. This guide covers both debugging options available: using the onboard XDS110 JTAG debugger with OpenOCD for open-source debugging capabilities. The guide includes instructions for XDS110 firmware updates, OpenOCD setup, and examples of debugging U-Boot on the A53 core. For detailed hardware information about the phyCORE-AM64x JTAG debug interface, please see the JTAG chapter inside the Hardware Manual.
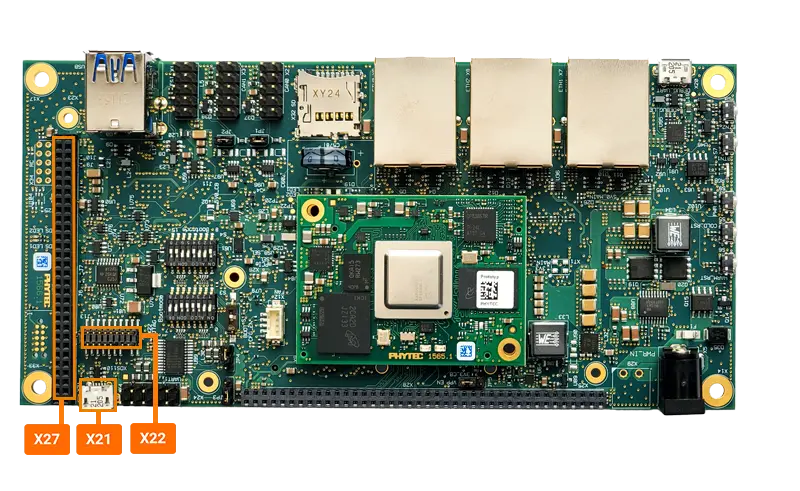
Location |
Header Type |
Notes |
|---|---|---|
X21 |
micro-USB |
XDS110 JTAG debugger |
X22 |
Compact TI 20-Pin JTAG Header |
Requires external JTAG debugger |
X27 |
60-pin Expansion Connector |
Requires external JTAG debugger |
Updating & Flashing XDS110 Firmware
Your phyBOARD-Electra AM64x is typically shipped with the XDS110 debugger already flashed and ready for debugging. However, if you need to update the firmware, follow the instructions below.
Before proceeding, you’ll need to:
Install Code Composer Studio (CCS) from https://www.ti.com/tool/CCSTUDIO
Install the required udev rules during CCS installation
Ensure your system recognizes the XDS110 debugger when connected via USB
If your phyBOARD-Electra AM64x requires a firmware flash for the XDS110, you will see the following messages if connecting to the XDS USB Debug port:
sh-host:~$ sudo dmesg -w
...
usb 1-3: usbfs: process 99691 (xdsdfu) did not claim interface 0 before use
usb 1-3: usbfs: process 99698 (xdsdfu) did not claim interface 0 before use
usb 1-3: USB disconnect, device number 8
usb 1-3: new full-speed USB device number 9 using xhci_hcd
usb 1-3: New USB device found, idVendor=1cbe, idProduct=00ff, bcdDevice= 0.01
usb 1-3: New USB device strings: Mfr=1, Product=2, SerialNumber=3
usb 1-3: Product: Tiva Device Firmware Update
sh-host:~$ cd $HOME/ti/ccs1110/ccs/ccs_base/common/uscif/xds110
sh-host:~$ yes | ./xdsdfu -b boot_loader.bin
sh-host:~$ ./xdsdfu -f firmware.bin -r -v
sh-host:~$ ./xdsdfu -e
VID: 0x0451    PID: 0xbef3
Device Name:   XDS110 Embed with CMSIS-DAP
Version:       3.0.0.19
Manufacturer:  Texas Instruments
Serial Num:    1234
Mode:          Runtime
Configuration: Standard
Using OpenOCD for Debugging
OpenOCD (Open On-Chip Debugger) is an open-source tool that provides debugging, in-system programming, and boundary-scan testing for embedded target devices.
Installation
sh-host:~$ sudo apt update
sh-host:~$ sudo apt install openocd gdb-multiarch
For installation instructions on non apt based distros, please visit the official OpenOCD documentation at https://openocd.org/pages/getting-openocd.html.
Starting OpenOCD
Before connecting the XDS110 debugger, ensure your device is in a suitable state for debugging. The most reliable state is when the processor is halted, such as at the U-Boot shell prompt.
sh-host:~$ openocd -f board/ti_am642evm.cfg

Open On-Chip Debugger 0.11.0+dev-00626-g92c4e634d (2022-03-21-20:50)
Licensed under GNU GPL v2
For bug reports, read
    http://openocd.org/doc/doxygen/bugs.html
adapter speed: 2500 kHz

Info : Listening on port 6666 for tcl connections
Info : Listening on port 4444 for telnet connections
Info : XDS110: connected
Info : XDS110: vid/pid = 0451/bef3
Info : XDS110: firmware version = 3.0.0.19
Info : XDS110: hardware version = 0x002f
Info : XDS110: connected to target via JTAG
Info : XDS110: TCK set to 2500 kHz
Info : clock speed 2500 kHz
Info : JTAG tap: am625.cpu tap/device found: 0x0bb7e02f (mfg: 0x017 (Texas Instruments), part: 0xbb7e, ver: 0x0)
Info : starting gdb server for am625.cpu.sysctrl on 3333
Info : Listening on port 3333 for gdb connections
Info : starting gdb server for am625.cpu.a53.0 on 3334
Info : Listening on port 3334 for gdb connections
Info : starting gdb server for am625.cpu.a53.1 on 3335
Info : Listening on port 3335 for gdb connections
Info : starting gdb server for am625.cpu.a53.2 on 3336
Info : Listening on port 3336 for gdb connections
Info : starting gdb server for am625.cpu.a53.3 on 3337
Info : Listening on port 3337 for gdb connections
Info : starting gdb server for am625.cpu.main0_r5.0 on 3338
Info : Listening on port 3338 for gdb connections
Info : starting gdb server for am625.cpu.gp_mcu on 3339
Info : Listening on port 3339 for gdb connections
At this point you should be able to start gdb (or gdb-multiarch for cross-architecture debugging) and attach to the halted CPUs.
sh-host:~$ gdb-multiarch

# Attach with gdb to am625.cpu.main0_r5.0
(gdb) target remote localhost:3338

# Dump ROM version (stored in register 0x4182FF84)
(gdb) x/s 0x4182FF84
0x4182ff84:     "09/12/20am64x"
Debugging U-Boot on the A53 Core
This section demonstrates how to debug U-Boot running on the Cortex-A53 core using the RTC command as an example. We’ll walk through connecting GDB and setting up source-level debugging.
First, connect GDB to the A53.0 CPU where U-Boot is executing:
sh-host:~$ gdb-multiarch

# Connect to the A53.0 core
(gdb) target remote localhost:3334
For source-level debugging, you’ll need two things:
The non-stripped U-Boot ELF file (generated during the U-Boot build process)
The relocation address where U-Boot is running (we’ll obtain this in the next step)
To find the relocation address, run the following command at the U-Boot prompt:
sh-phyboard-electra-am64xx-2:~# bdinfo

=> bdinfo
boot_params = 0x0000000000000000
DRAM bank   = 0x0000000000000000
-> start    = 0x0000000080000000
-> size     = 0x0000000080000000
flashstart  = 0x0000000000000000
flashsize   = 0x0000000000000000
flashoffset = 0x0000000000000000
baudrate    = 115200 bps
relocaddr   = 0x00000000ffecf000  <- relocation address
reloc off   = 0x000000007f6cf000
Build       = 64-bit
Next, load the U-Boot ELF file into GDB at the correct relocation address:
(gdb) add-symbol-file ~/path/to/u-boot/a53/u-boot 0xffecf000

add symbol table from file "~/path/to/u-boot/a53/u-boot" at
.text_addr = 0xffecf000
(y or n) y
Reading symbols from ~/path/to/u-boot/a53/u-boot...
Now we can begin debugging. Let’s set a breakpoint at the RTC command handler and continue execution:
 (gdb) break do_rtc

 Note: breakpoint 1 also set at pc 0x80822830.
 Breakpoint 2 at 0x80822830 (2 locations)
 (gdb) c
 Continuing.
With the breakpoint set, switch to your U-Boot console and trigger the breakpoint by running:
sh-phyboard-electra-am64xx-2:~# rtc
GDB will now halt at the breakpoint we set. From here, you can use standard GDB commands to debug the code:
Breakpoint 1, do_rtc (cmdtp=0xfffb1888, flag=0, argc=1, argv=0xfdec1260) at ../cmd/rtc.c:111
111             if (argc < 2)
(gdb)
# Single-step to the next instruction
(gdb) s
153                     return do_rtc_write(dev, argc - 1, argv + 1);
# Examine the dev variable
(gdb) p dev
$2 = (struct udevice *) 0xfdec1260
- Common GDB commands you can use:
s or step: Step into function calls
n or next: Step over function calls
c or continue: Continue execution
p or print: Print variable values
bt or backtrace: Show the call stack
For more detailed information about debugging U-Boot on TI K3 devices, refer to the official U-Boot documentation: https://docs.u-boot.org/en/latest/board/ti/k3.html#debugging-with-openocd